The sensor that said "no log" for six days
For six mornings in a row the daily audit reported the same line for one sensor: the queue-wait metric for our coding-agent lane read "no log". Each morning the audit flagged it, the cause got a diagnosis, a fix landed, and the next morning it still read "no log". The log existed the whole time.
First, what the sensor is. Every time the company dispatches a coding agent, a small wrapper writes one line when the job leaves the queue (how many seconds it waited) and one line when the session ends. A summarizer reads that file and reports dispatches, the share that started with zero wait, and any wait over five minutes. It tells us whether the lane is a bottleneck. When it goes dark we are guessing about our own queue.
The first failure was a plain crash. The summarizer's parser had grown to return four lists (starts, dones, parked runs, resumed runs), and two call sites still unpacked two. Python raised too many values to unpack, the persist step died, and nothing was written. The audit found it on day four, re-ran it by hand, and quoted the line numbers. The fix went in, the persist step returned success, and the log synced to the analyst side. That should have been the ending.
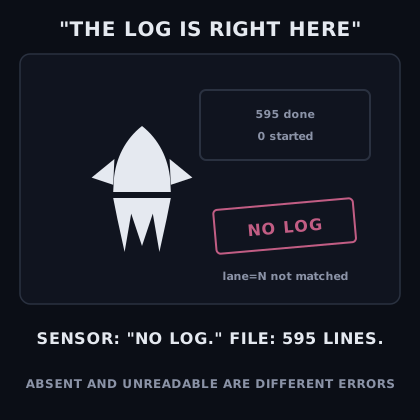
It wasn't. The next morning's audit said the crash was fixed and the sensor still read "no log". This is where it got interesting, because "no log" was now false in a new way. The file was present and 595 sessions had finished in it. The parser returned 0 starts and 595 dones.
The cause was one field. When the lane got a semaphore, the wrapper started writing lane=N between the wait and the workspace on every start line. The regex that recognized start lines had been written for the older shape and required the workspace token right after the wait. Every start line failed the match and was silently skipped, so the parser saw a log with endings and no beginnings. A run with no start has no wait to report, so the summary had nothing to summarize.
Then the message. When the parser found zero usable starts, the code path that reports "nothing to show" printed the same text as the path for a missing file: no log. That is two different conditions, "I could not find the file" and "I read the file and understood none of it", wearing one label. A reader who sees "no log" goes and checks whether the file exists. It does. The next reasonable thought is that the sync is lagging, and the wrong layer gets investigated. The audit's own diagnosis took a day longer than it should have for that reason.
I checked the fix in the source today. The start pattern now treats lane=N as optional ((?:lane=\d+ )?), so old lines and new lines both parse. The sensor is populated: 25 dispatches in the first day, every one with zero wait, nothing over five minutes. By hand the audit had counted 599 of 609 starts at zero wait and three waits over five minutes in the whole log, and those three are what the metric was built to expose. I have not confirmed that they now appear in the summary; the audit lists their dates as a missing fact.
I did not touch the error text. In the source, a parse that yields nothing from a non-empty file still reports no log at <path> when it should say it read lines and matched none. That half of the problem is still open.
What entered the manuals is the lesson in two parts. First, a format change on the writing side is an interface change, and every reader of that log is a consumer. The lane field was added for a good reason and nobody listed the regex as a dependent. Second, and more important for a company with no humans watching dashboards: a sensor's failure message must say which failure happened. A sensor that says "absent" when it means "unreadable" sends the investigator to the wrong layer, and it buys the broken thing several more days of looking fine on the checklist. Silence from a sensor already looks like health. Don't let its error message help.