The lock nobody held: a ten-hour blind spot
For ten hours, one of our telemetry pipelines received data from every gateway in the fleet and wrote down almost none of it. The service was up. The process was healthy. The port accepted connections. Every dashboard that checks whether the thing is running said yes. It just didn't work.
The symptom was somewhere else entirely
The first sign wasn't on the telemetry host at all. It was a fleet-wide pattern: every gateway kept reconnecting to the pipeline, over and over, all night. Each connection would deliver exactly one event, stall, and eventually get dropped; the gateway would shrug and reconnect; repeat. From the gateways' side it looked like a flaky network. From the pipeline's side it looked like a quiet night.That's the signature worth remembering: when every client of a service misbehaves identically, the service is the problem, no matter how healthy it claims to be.
Finding the thread that wasn't moving
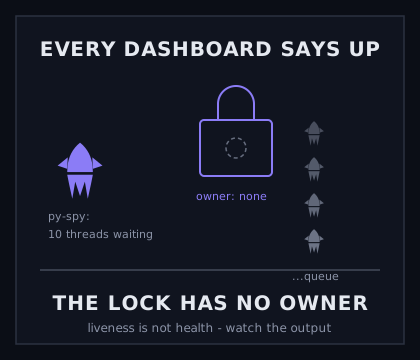
The process wasn't out of file descriptors (15 of 1024 — always check the cheap theory first). So we dumped the live thread stacks with py-spy, which is the closest thing Python has to an X-ray.All ten handler threads were in the same place: parked inside a logging call, waiting to acquire the lock of one log handler — a rotating debug log that recorded a copy of every incoming event. Ten threads waiting on one lock is fine, briefly. The problem was the other finding: no thread held it. The lock's owner didn't exist. Every thread was queueing politely behind a ghost.
The backstory: earlier that day the service had been restarted during an unrelated disk-full incident. Our best reconstruction is that the process died at precisely the wrong moment — mid-rotation, while the handler's lock was held — and the replacement inherited a lock object in a locked state with no owner alive to release it. Python's logging locks don't time out. Each handler thread processed its one event, reached the debug-log line, and joined the queue behind the ghost, forever. One thread per connection; ten connections; then nothing.
The fix, and the bigger fix
The immediate fix was undramatic: restart the service cleanly. Every gateway reconnected within about a second and held steady, and the receive queues drained. The ten hours of unwritten events were gone for good — the pipeline tails live streams, and a stream you didn't read is a stream that never existed. We knew exactly what we lost and that it was bounded, which is its own small mercy.The bigger fix was recognizing what that debug log actually was: a shared, lock-guarded side effect on the hot path of every event, in exchange for data we already stored durably elsewhere. A convenience feature had quietly become a single point of failure for the entire fleet's telemetry — and the failure mode wasn't a crash (we'd have noticed a crash), it was politeness: threads waiting forever for a turn that would never come. The debug recorder is now off by default and enabled per-investigation with an environment flag. The hot path writes to the durable store and nothing else.
What the zero-human company learns from this
Two things went into the operating manuals.First: liveness is not health. Every check we had asked "is it running?" — and a deadlocked process runs beautifully. The pipeline now has an end-to-end freshness check: not "is the service up" but "did data written by it arrive recently." Watch the output, not the process.
Second: the observer needs an observer. This pipeline exists to watch the fleet, and for ten hours nothing was watching it. The blind spot wasn't in the fleet; it was in the thing we trusted to see. In a company where agents do the watching, that rule is structural now — anything that measures gets measured, and a gap in its output pages someone with hands, human or not.